The United States of Home Decor: Interior Design Spending Hotspots Ranked
Refreshing your home decor can make a space feel brand new without the hassle of relocating. However, prices can add up when buying new furnishings, with the average American household spending around $2,750 each year.
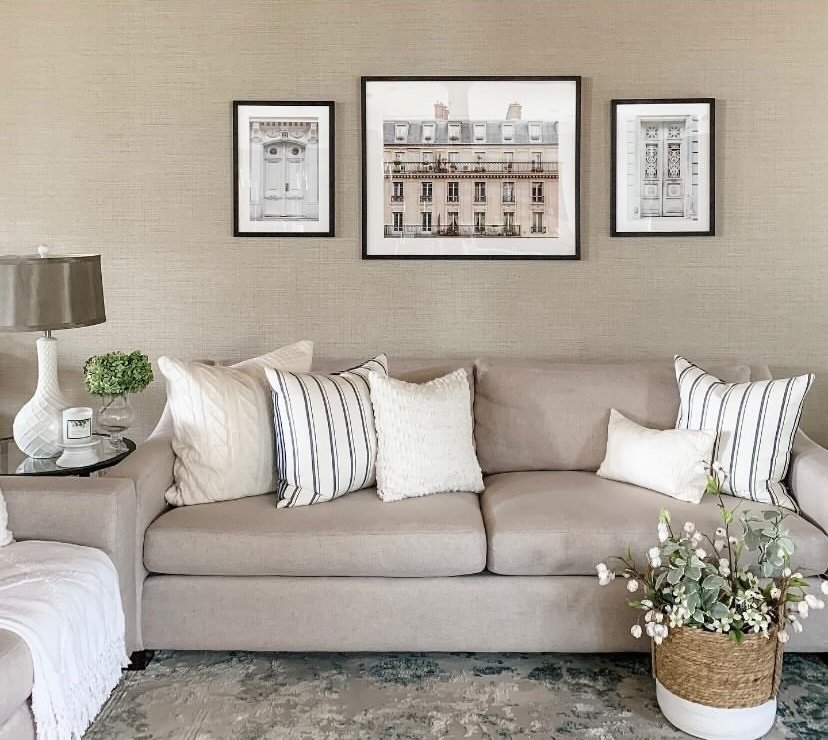
But upgrading your home doesn't have to break the bank. With simple, high-impact additions like custom picture frames, you can elevate your space, showcase your style, and bring new life to your home without a complete redesign.
We’ve collected data on household expenditures across major U.S. metropolitan areas and regions to reveal where people are investing the most in their living spaces and how these trends are evolving.
Key findings
|
U.S. cities that spend the most on home decor
Home decor spending can reflect many things, from disposable income and cost of living to interior design trends.
We’ve found the metropolitan statistical areas (MSAs) that spend the most on household furnishings and equipment, such as sofas and decorative items like framed canvas prints.
MSAs: Regions defined by the U.S. government to help collect and share data. Each includes a central city with at least 50,000 people, plus nearby areas closely connected to it through jobs, commuting, and daily life.
The average annual spend across all locations in this study is $2,752, but some areas spend almost a quarter (24%) more than that.
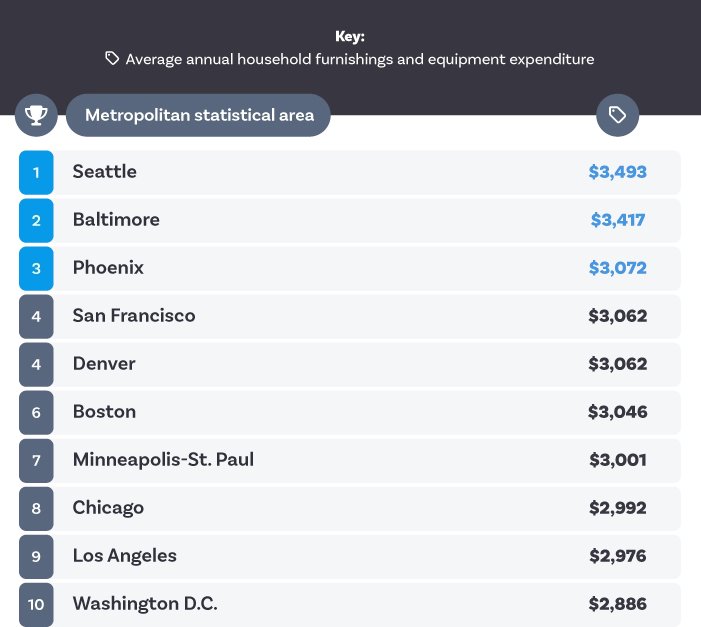
Seattle’s average annual furnishings spend: $3,493
Households in the Seattle area spend nearly a quarter more than the national average, at $3,493 per year.
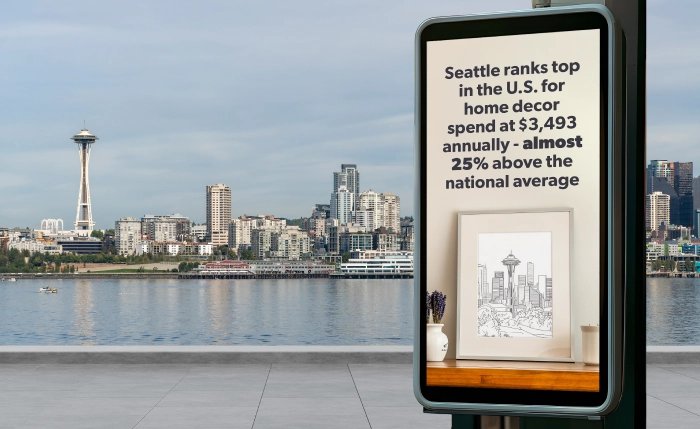
This could be due to the high income across the area, meaning residents may have more disposable income to spend on their home decor. Almost three in 10 (29.2%) of households in Seattle have an income in the $200k+ range, which is more than double the U.S. average of 12.6%.1
Baltimore’s average annual furnishings spend: $3,417
Baltimoreans spend just $76 less than Seattle residents each year, with an average total of $3,417 – two-fifths (43.9%) more than households in the lowest-ranking city, Philadelphia.
Part of Baltimore's charm is the blend of historic architecture and contemporary touches, which may encourage residents to invest in both restoration and modern decor, such as mid-century furnishings and framed artwork that mimics the city’s culture.
Phoenix’s average annual furnishings spend: $3,072
On average, people in Phoenix spend just over $3,000 on home decorations and furniture each year. This could be on anything from furniture made from organic materials and rugs in earthy tones, to rustic artwork that shouts classic Southwestern design.
High incomes could play a part in this ability to spend higher than average, with weekly wages in the top 15% of large regions in America.2 The cost of living is also more expensive in the area - 7% above the national average - meaning home decor items may cost more here than elsewhere.3
Cities where decor spend has increased the most
In addition to the current top-spending cities, our research has also revealed the places where homeowners are increasing their interior design investment, with some other regions quickly catching up to the top players.
The most significant year-on-year increases often reflect broader trends such as housing market shifts and renewed interest in home personalization.
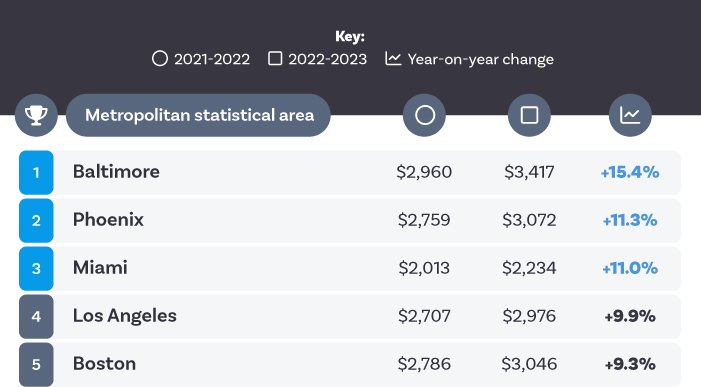
Baltimore’s change in home decor spending: +15.4%
Baltimore isn’t just one of the top spenders, it is also one of the fastest growers, with a 15% jump in annual decor spend from $2,960 to $3,417 in recent years. The city ranked tenth for interior design spend in 2021/22, but surged into second place in 2022/23.
With spending still rising more rapidly than in any other city, it could be set to take over as the interior investment capital of the U.S. in years to come. Baltimore's slowing housing market could be contributing to this trend, prompting many homeowners to stay put and improve rather than move by investing more in their living environments.4
Phoenix’s change in home decor spending: +11.3%
Spending on home furnishings and decorations also increased by more than a tenth (11.3%) in Phoenix. In 2021/22, the MSA was in the lower half of spenders across the U.S., at an average of $2,759 yearly, before this figure rose to $3,072 by 2022/23.
This trend doesn’t show any signs of slowing down either, with almost 12,000 annual searches for ‘home decor’ inspiration in Phoenix.
Miami’s change in home decor spending: +11.0%
Miami falls just short of Phoenix’s rise. Between 2021/22 and 2022/23, decor spending in Miami increased by 11%, from $2,013 to $2,234.
Some popular aesthetics in Miami include incorporating bold colors alongside beachy wooden furnishings. One trend that is making the rounds is ‘Miami Art Deco’, which is a fun take that combines tropical prints, the classic Miami color scheme of vibrant pastels like pink and aqua, and Art Deco shapes.5
Homeowners who have cut back on interior spend the most
On average across the U.S., spending on interior design is relatively stable - down by just 2% year-on-year - but some cities have seen more significant decreases in home furnishings purchases.
This could be a sign of cost-of-living pressures or that people in these areas are being more creative with their decor, opting for budget-conscious redesigns.
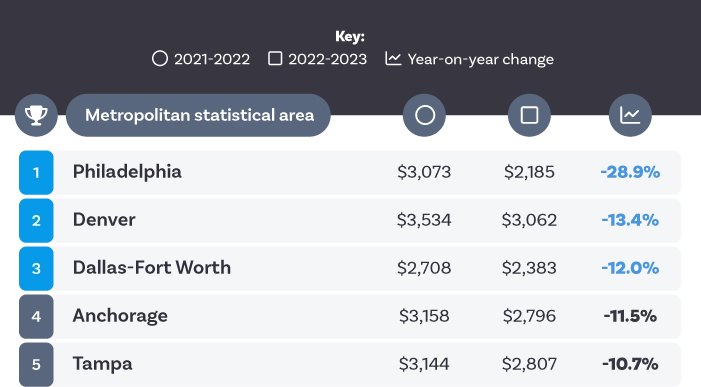
Philadelphia’s change in home decor spending: -28.9%
Philadelphia residents’ home decor spending has dropped dramatically, from $3,073 to $2,185 – a decrease of almost a third (29%). This is the largest cutback in the country and is more than double that of any other city.
This drop could be down to a mixture of economic factors and inflation influencing behavior. At the start of 2023, consumer spending reduced across the board as inflation increased, but wages remained steady, meaning people may have been more cautious before making any home upgrades.6 This has continued into 2025, as businesses have seen consumers look for ways to slow spending with rising prices.7
Denver’s change in home decor spending: -13.4%
Despite being a top-five overall spender, Denver's decline suggests a pause in the rapid home improvement trends. The average spend had a year-on-year drop of over 13% from $3,534 to $3,062.
Despite this, Denver is home to some of the biggest home decor spenders. People in the area are still buying home decor at a higher rate than elsewhere in the U.S., but they’re just not spending as much as they used to.
Dallas-Fort Worth’s change in home decor spending: -12.0%
In Dallas-Fort Worth, home decor spending has decreased from around $2,708 to $2,383 on average – a 12% reduction. There were rising mortgage rates and inflation during those years. Household affordability has declined in Dallas, possibly prompting homeowners to hold back on non-essential purchases.8
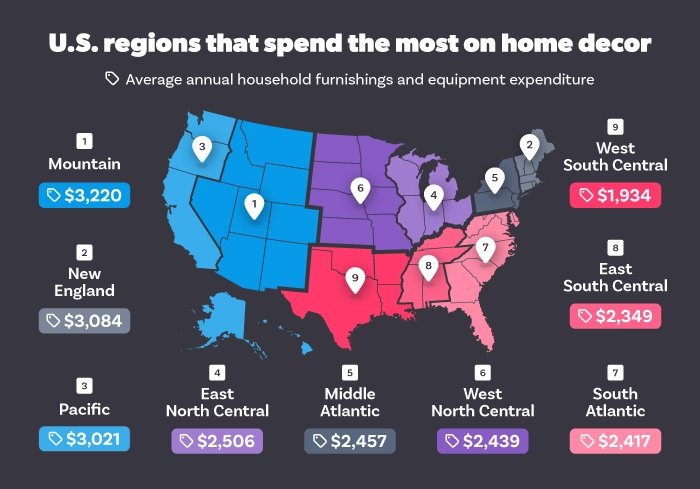
U.S. regions that spend the most on home decor
In some areas of the country, home decor is embedded in lifestyle, with plenty of renovation projects and home updates to keep up with trends.
Looking at broader regional divisions, these are the state groupings that are currently investing the most in their interior design:
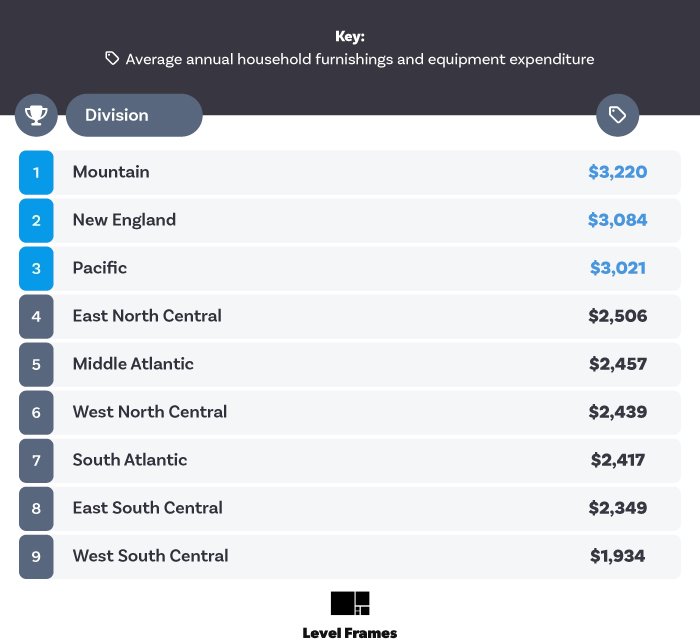
Mountain States’ average annual furnishings spend: $3,220
The Mountain States – Arizona, Colorado, Idaho, Montana, Nevada, New Mexico, Utah, and Wyoming – collectively have the highest average expenditure on home decor, at $3,220 a year. However, this isn’t as high as it once was, with the figure at $3,282 in 2021/22.
Some interior trends that contribute to this spend include Pueblo Revival style, which is popular in New Mexico. This trend focuses on thick, rounded walls, curved corners, and earthy colors.
Home decor, such as furniture or artwork, that integrates these features can be quite expensive due to the specialist materials and skills needed to produce them.
New England’s average annual furnishings spend: $3,084
New England may be known for its historical charm, but keeping this up proves to be costly, with annual household decor spending at $3,084. Homes in cities like Boston, Providence, and Hartford often blend traditional architecture with modern design touches.
We may see New England take the top spot in the future, as it has seen the highest growth in decor year-on-year, up by a tenth (10.4%) in the most recently documented period.
Pacific’s average annual furnishings spend: $3,021
In third place is the Pacific region’s average annual spending of $3,021. Made up of states including Alaska, California, Hawaii, Oregon, and Washington, this area's home decor styles range from coastal charm and log cabins all the way to tropical elements and bold colors.
Tips on creating impactful decor that doesn’t cost a fortune
Despite high interior design spending across multiple cities and regions of the country, redecorating doesn’t have to be too expensive. Small changes can give high-impact results, especially when focusing on quality, longevity, and meaning.
Here are some tips to help:
Invest in fewer, better pieces
Rather than chasing every new trend, choose high-quality furniture and decor that stands the test of time. Fast-changing styles may be tempting, but they can quickly date a space.
Curating your space slowly leads to a more personal and sustainable result that reflects who you are, not just what’s in style. A ‘buy well, buy once’ mentality, which favors quality pieces that offer longevity and impact, can reduce your expenditure and waste.
Refresh by rotating your wall art
A ‘buy-once’ mindset doesn’t mean your space needs to feel stale and static. By rotating art, prints, posters, and even framed records, you can switch up your home’s interior seasonally to keep things feeling fresh.
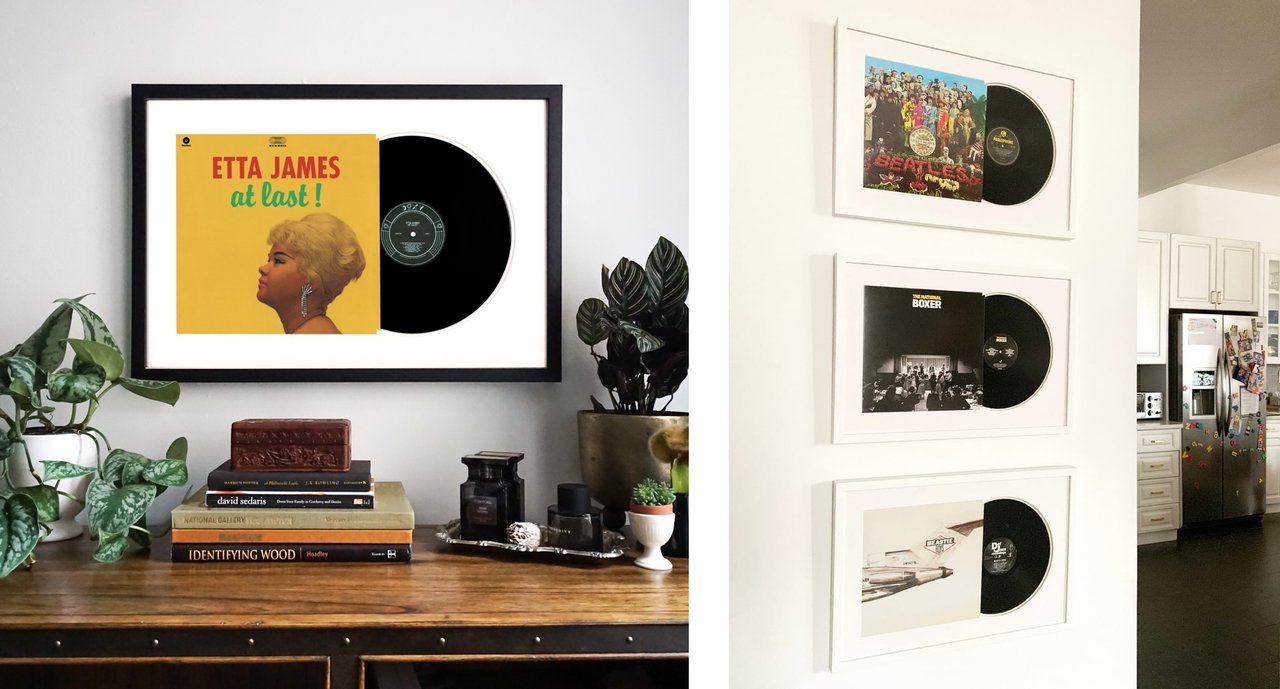
Store any unused pieces safely (away from harsh light, odors, and moisture) so they can be reintroduced into your living space in future years.
Lean into sentimental value
Incorporate sentimental pieces, such as framed wedding photos, travel memories, or even handwritten notes, to save on buying new art and add a touch of personalization to your space.
You can even rearrange these existing pieces of decor to create a sentimental gallery wall of memories that can completely change the focal point and impact of a room.

We love to mix frame sizes, orientations, texture, and colors to add energy and depth.
Methodology
Level Frames is a leading supplier of custom, handcrafted frames. We offer an online service for printing and framing photos that ship right to your door, making updating your home decor a breeze.
As a brand deeply rooted in the world of home design, we wanted to better understand how Americans are spending on decor. So, we analyzed detailed spending data across U.S. locations and compared it to previous years to find how this has changed over time.
All data was sourced from the U.S. Bureau of Labor Statistics’ Consumer Expenditure Surveys, looking at the ‘Household furnishings and equipment’ category.
Specifically, we used the Metropolitan Statistical Areas (MSAs) tables to show spending per consumer in major U.S. cities in 2022-2023.
We also used the Division of Residence tables to show the same data broken down by broad U.S. regions (e.g. East North Central, Mountain, Pacific).
Data from 2021-2022 was also used to calculate year-on-year changes in home decor spending as a %.
Other sources
- Seattle Income and Housing Data - Data USA
- Phoenix Metro Area Regional Overview - Arizona MAG
- Cost of Living in Phoenix - Payscale
- Baltimore Real Estate Market Overview - Steadily
- Interior Design Trends: Miami Art Deco - Lick
- Summary of Economic Activity, January 2023 - Federal Reserve Bank of Philadelphia
- Summary of Economic Activity, July 2025 - Federal Reserve Bank of Philadelphia
- Dallas Housing Affordability - Federal Reserve Bank of Dallas


