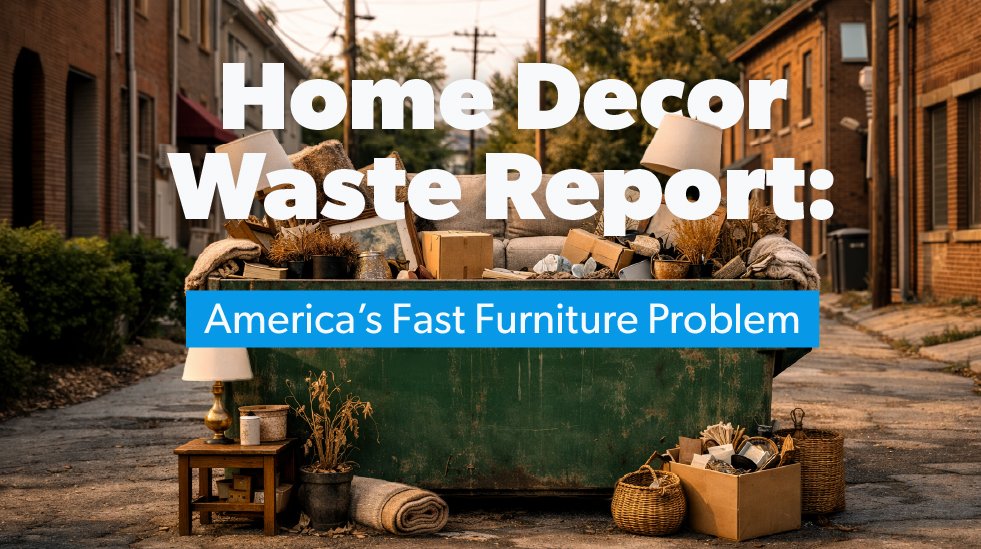
Revealed: Over 12 million tons of home decor goes to landfill
Whether it’s replacing worn furniture or adding finishing touches like custom framing, refreshing your decor can breathe new life into a home.
But the growing popularity of inexpensive, trend-led pieces has made home decor easier to replace than ever before, and the environmental consequences are often overlooked.
Our research has found that over 12 million tons (26.7 billion lbs) of home decor is sent to landfills in the US each year.
That’s the equivalent of almost 33 Empire State Buildings or 21,679 A380 airbuses – the largest type of passenger plane.1
The state of home decor waste in the US: Key takeaways
- Over 26 billion lbs of home decor items are sent to landfills in the US each year (EPA figures), showing the scale of the disposal challenge.
- Furniture and furnishings dominate home decor landfill waste, with 19.36 billion pounds landfilled annually, according to the latest figures.
- Carpets and rugs added another 4.92 billion pounds (2.46 million tons) to landfills in the same period, with the majority disposed of rather than recycled.
- California, Florida, and New Hampshire are the largest contributors of decor waste per person, revealing clear regional differences in disposal activity.
Home decor landfill by the numbers
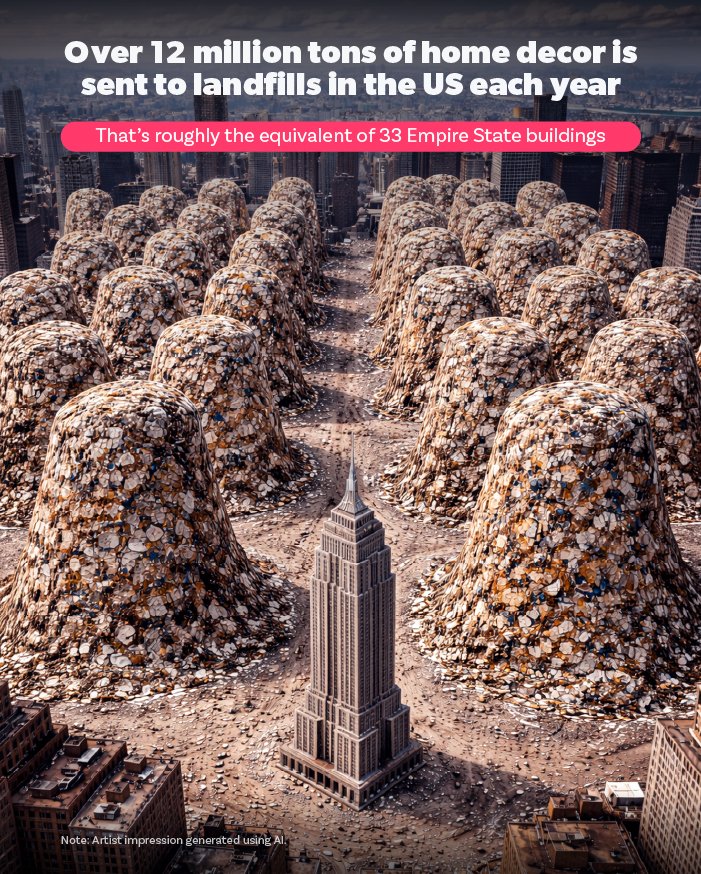
According to the US Environmental Protection Agency’s (EPA) latest national waste statistics, 12 million tons of home decor-related waste is dumped in landfills across the US in a single year.
Furniture and furnishings accounted for 19.36 billion pounds of landfilled waste, with the agency estimating that 80.1% of the category ends up in landfills.
Carpets and rugs added an additional 4.92 billion pounds to landfills in the same period.
This huge amount of waste is fueled by the home trend cycle, which encourages frequent upgrades and shortens the lifespan of decor items.
Our research shows that Americans spend close to $2,750 every year on decor, while a recent survey shows that over a third (34%) have bought things specifically because of social media appeal.2
Rugs are the most commonly discarded item in US households
We’ve analyzed survey data to identify the decor items homeowners most often throw away or replace.
|
Rank |
Decor Type |
Life span (years) |
|
1 |
Rugs |
4.5 |
|
2 |
Fast furniture |
<5 |
|
3 |
Low-grade wood furniture |
5 |
|
4 |
Sofa |
7 |
|
5 |
Window blinds |
7-8 |
|
6 |
Office chair |
7-10 |
|
6 |
Carpet |
7-10 |
|
8 |
Kitchen cabinet hinge |
10-15 |
|
9 |
Solid wooden furniture |
15-20 |
|
10 |
High-quality kitchen cabinet |
20-25 |
In many homes, commonly discarded decor items are also the ones that are often replaced for aesthetic reasons, rather than because they are genuinely at the end of their practical usefulness.
Soft furnishings and trend pieces tend to be the most vulnerable, with average lifespans of less than five years, because they sit at the intersection of fast furniture cycles and wear-and-tear - think rugs and budget furniture inspired by fleeting design trends.
How often do people buy different decor items?
When we examine the frequency of decor purchases among homeowners renovating their properties, we find that certain items are repurchased much more often than others.
Our analysis of Houzz data shows that soft furnishings are the most likely to be replaced. Nearly half (49%) of homeowners buy new rugs when renovating their properties, followed closely by 45% who purchase new pillows and throws. Large furniture and artwork are also top purchases (41% each).
|
Rank |
Decor Type |
Frequency of purchase (during renovation)
|
|
1 |
Rugs |
49% |
|
2 |
Pillows and throws |
45% |
|
3 |
Large furniture |
41% |
|
3 |
Artwork |
41% |
|
5 |
Small furniture |
39% |
|
6 |
Lamps |
34% |
|
6 |
Window treatments |
34% |
|
6 |
Storage/organization |
34% |
|
9 |
Holiday decor |
27% |
|
9 |
Mirrors |
27% |
When you compare replacement frequency with the decor lifespan insights, the same patterns emerge: the items replaced most often are also the items most likely to be discarded - this is the ‘trend treadmill’ in action. People are not just buying more decor, they are buying it more often, shortening product lifespans across entire categories.
Rapidly evolving social media trends accelerate this cycle. Trend-driven decor tends to rise and fall in months, not years, encouraging homeowners to treat furnishings like seasonal purchases.
Our research has found that design trends have a lifecycle of just 10 months, highlighting the scale of the fast furniture problem.
Explore the average lifecycles of interior design trends in our Design Trends Lifecycle report.
States that send the most decor to the landfill
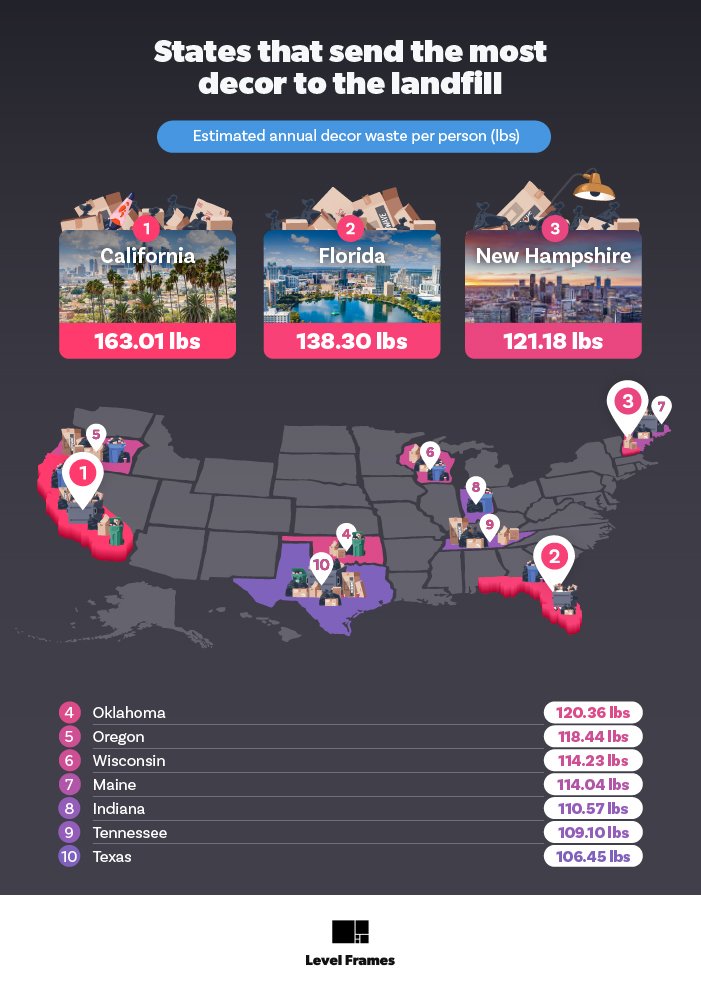
Decor waste figures aren’t consistent across the US; we’ve analyzed decor waste volumes by state and per capita to reveal the biggest contributors.
|
Rank |
State |
Est. total decor waste (lbs) |
Est. per person (lbs) |
|---|---|---|---|
|
1 |
California |
6.5bn |
163.01 |
|
2 |
Florida |
3.4bn |
138.30 |
|
3 |
New Hampshire |
172.4m |
121.18 |
|
4 |
Oklahoma |
500.5m |
120.36 |
|
5 |
Oregon |
510.5m |
118.44 |
|
6 |
Wisconsin |
687.9m |
114.23 |
|
7 |
Maine |
161.5m |
114.04 |
|
8 |
Indiana |
775.4m |
110.57 |
|
9 |
Tennessee |
805.9m |
109.10 |
|
10 |
Texas |
3.5bn |
106.45 |
-
California
California residents are the biggest contributors to the decor landfill problem, with the largest per-capita annual waste volume of around 163lbs. This is more than 20lbs above that of Florida, which ranks in second place. California is the wealthiest state in America and the fourth-largest economy in the world, with a GDP of over $4.1 trillion, highlighting the state’s spending power.3 This may contribute to more frequent decor upgrades and, as a result, more decor going to landfill from this region. -
Florida
Florida’s high rates of decor waste per person, at around 138lbs each year, may reflect the state’s relatively high household churn; according to census data, the region gained more than 196,000 residents between 2024 and 2025, potentially driving more home buying, moving, and re-furnishing.4 -
New Hampshire
New Hampshire ranks in third place, with homeowners producing around 121 lbs of home decor waste each year. In terms of spending power, New Hampshire is one of a small number of states that don’t impose a statewide sales tax, meaning furniture costs are often lower than in other states, like California (7.25% sales tax) and Florida (6%).5
This makes it more affordable for New Hampshire residents to purchase and replace decor more often, as spending is less constrained by taxes, potentially contributing to the region's high waste volume.
The states that contribute the least furniture to landfill
These are the regions making the most sustainable home decor choices, with the lowest annual per capita decor waste.
|
Rank |
State |
Est. total decor waste (lbs) |
Est. per person (lbs) |
|
1 |
Rhode Island |
42.4m |
37.52 |
|
2 |
South Dakota |
44.2m |
47.13 |
|
3 |
Connecticut |
187.2m |
50.06 |
|
4 |
North Dakota |
42.2m |
51.99 |
|
5 |
Massachusetts |
396.2m |
54.46 |
|
6 |
Maryland |
366.5m |
57.66 |
|
7 |
Pennsylvania |
810.8m |
61.41 |
|
8 |
Michigan |
715.2m |
69.74 |
|
9 |
North Carolina |
810.1m |
71.21 |
|
10 |
West Virginia |
126.8m |
71.66 |
-
Rhode Island
Rhode Island produces the least decor waste annually per person, according to municipal solid waste figures. At just 37.52lbs per resident, Rhode Islanders are significantly below other states and contribute over 50lbs less than the national average (89.6lbs). At an average size of 1,688 square feet, Rhode Island properties are among the smallest in the US, which may limit the sizes and volume of furniture required. 6 -
South Dakota
The state has one of the highest homeownership rates in the US, at around 64% (2024), and is among the least densely populated, with just 11.3 people per square mile.7 These factors are associated with lower residential mobility as homeowners typically move less than renters, and may contribute to minimal decor turnover.South Dakota records the second-lowest amount of estimated decor waste per person, at 47.1lbs in a year. -
Connecticut
Connecticut is the third least wasteful state in the ranking, sending an estimated 69.74lbs of decor waste per person to landfill each year – nearly 20lbs less than the national average (89.6lbs). Connecticut has some of the highest average property prices in the US.8 These higher costs may force homeowners to be more mindful of their spending on decor and to focus on long-term home investments rather than trend-driven decor.
Why are so many Northeastern states in the bottom 10 contributors?
Four states, Rhode Island, Connecticut, Massachusetts, and Pennsylvania, are among the 10 lowest contributors to the furniture landfill problem. The region also reports the highest average landfill tipping fees in the US at $80.67 per ton.9
These higher tipping fees could encourage residents to reduce decor turnover or recycle unwanted items, rather than sending more to the landfill.
Expert tips on reducing decor waste
From our experience as an online custom framing service, we've seen the importance of choosing timelessness over trends.
To reduce waste and maximize value for money, look for timeless household decor that lasts for years, not seasons. As trend cycles speed up, it can be easy to feel like your home needs to be constantly updated, but when furniture and decor become nothing more than trend pieces, waste and environmental impact increase.
One of the easiest ways to step off the trend treadmill and decorate more sustainability is to invest in high-quality, versatile pieces. Timeless design doesn’t have to be boring; it’s about choosing decor that can adapt and be styled in different ways.

When you buy custom frames, it’s a great way of getting lifetime value from your decor. A high-quality frame made with conservation grade materials should last for decades, and you can change the art or photo inside as your style evolves. It’s a great way to refresh any room and limit waste at the same time.
Methodology
Level Frames is an online custom framing service that offers an end-to-end experience for framing your best photos, artwork, vinyls, and more.
We help you transform your home in just minutes by framing special moments and memories in handcrafted, museum-quality frames that ship right to your door.
1) National decor waste totals
We used EPA data to find the most recent national US estimates for landfill disposal of home decor, including furniture and furnishings, carpets, and rugs.
We then combined these categories to estimate total home decor landfill waste in the US This EPA data is current through calendar year 2018, which is the latest available in the EPA Facts and Figures tables.
2) State-level ranking
We used Sensoneo’s Global Waste Index to show the municipal solid waste (MSW) generated per person in each state.
We then estimated home decor waste in each state by:
- Multiplying MSW per capita in each state by the state population to estimate total MSW for the state
- Dividing estimated national home decor landfill waste (section 1) by total US MSW to estimate home decor waste share (%)
- Multiplying each state’s total MSW estimate by the home decor waste share (%) to model total home decor waste, and per-person figures
Note: State decor waste figures are modelled estimates, based on national decor waste share and state MSW totals. We included only states with data from 2020 onward.
3) Replacement frequency/consumer behaviour
We used the 2025 Houzz and Home Study to support consumer insights on decorating and purchasing patterns.
We also reviewed WifiTalents’ furniture and home decor topic hub, to show how often people purchase products in different decor categories.
All data was collected in February 2026 and is correct as of then.
Other sources
- EPA & The Empire State Building & Lufthansa (national landfilled wasted (12,140,000 tonnes) divided by the weight of The Empire State Building (365,000 tons) and a Lufthansa Airbus A380–800 (560 tonnes)
- LendingTree
- Governor Gavin Newsom
- United States Census Bureau
- New Hampshire Department of Revenue Administration & California Department of Tax and Fee Administration & Florida Department of Revenue
- Bob Vila
- USA Facts & World Atlas
- Zillow via CT Mirror
- Waste Optima


